


The last day of trading for the first half of 2025 ended with a bang. The S&P 500 ($SPX) and Nasdaq Composite ($COMPQ) closed at record highs — an impressive finish, given the year has seen significant swings.
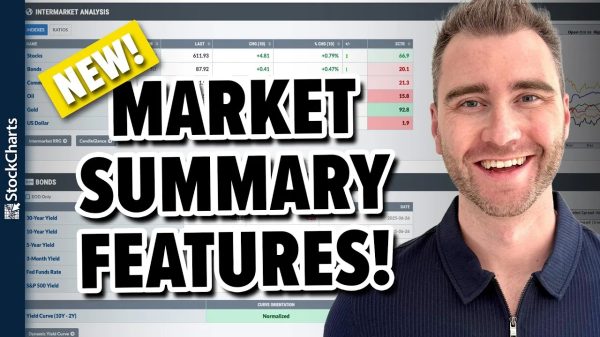
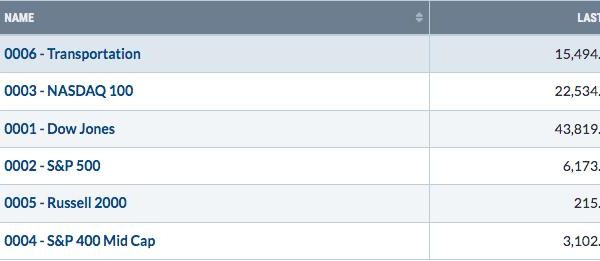
We saw signs of investors rotating into technology stocks last week when the Nasdaq 100 ($NDX) hit a record high. Looking at the one-week timeframe in the US Indexes tab in the Equities panel in the StockCharts Market Summary page, the $NDX has seen the largest percentage gain (+3.76%) and is trading 9.94% above its 200-day simple moving average (SMA). The Nasdaq Composite is a close second, with the same percentage gain and trading 8.92% above its 200-day SMA.
FIGURE 1. EQUITIES PANEL OF THE MARKET SUMMARY PAGE. Here, you see a snapshot of the one-week performance of the major US indexes and how far they are from key moving averages. Image source: StockCharts.com. For educational purposes.
Is the Technology Rally Stable?
With technology stocks taking the lead again, it’s worth checking to see if market breadth supports the move.
Bullish Percent Index. The %Bullish Percent Indexes panel shows the Nasdaq 100 at 74%, which is in favor of the bullish move in technology stocks.New Highs vs. New Lows. On Monday, approximately 10% of stocks in the Nasdaq 100 hit all-time highs, while 0% of stocks hit a 52-week low. The semiconductor industry is the top-performing bellwether industry.
Armed with this data, let’s break down the Technology sector. Looking at the MarketCarpets format, we can see that software and semiconductors occupy a significant portion of the sector. The largest cap-weighted stocks are all in the green — Microsoft Corp. (MSFT), NVIDIA Corp. (NVDA), Broadcom, Inc. (AVGO), Taiwan Semiconductor Mfg. (TSM), and Oracle Corp. (ORCL).
FIGURE 2. MARKETCARPET OF THE ONE-WEEK PERFORMANCE OF THE TECHNOLOGY SECTOR. Mega-cap stocks such as MSFT, NVDA, AVGO, TSM, and ORCL were strong performers. Image source: StockCharts.com. For educational purposes.
Three semiconductor stocks — NVDA, AVGO, and TSM — make up most of the move in the entire sector, which makes it worth looking at a chart of the semiconductor stocks.
Semis Stay Strong
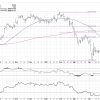
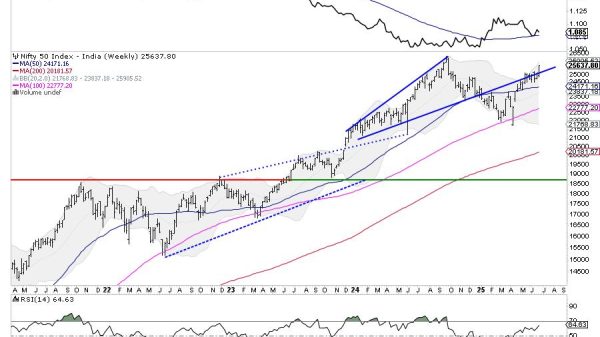
The six-month daily chart of the VanEck Vectors Semiconductor ETF (SMH) below shows a clear uptrend, with the 21-day exponential moving average (EMA) sloping up and the 50-day SMA about to cross above its 200-day counterpart.
FIGURE 3. SIX-MONTH DAILY CHART OF THE VANECK VECTORS SEMICONDUCTOR ETF (SMH). The ETF has been in a steady uptrend and is close to its all-time high. The RSI is above 70, and the PPO histogram is hovering above zero. Both support the bullish move in SMH, but it’s worth keeping an eye on momentum. Chart source: StockCharts.com. For educational purposes.
The relative strength index (RSI) is above 70 while the percentage price oscillator (PPO) histogram is just above zero. Despite Monday’s relatively flat day, all the above data support a bullish trend. A slowing momentum would be the first alarm bell for a pullback, with the first support being the 21-day EMA. That would be an opportune time to monitor the industry and, if you’ve considered adding either individual semiconductor stocks or ETFs to your portfolio, it’s worth monitoring the price action. Price could either reverse after hitting a key support level or continue falling.
As we head into the second half of 2025, the performance of semiconductors and technology stocks will dictate the direction of the market.
The Bottom Line
In a market that flip-flops from one day to the next, you might need a helping hand to prevent you from getting emotionally sidetracked. The Market Summary page is your compass, if you will, that helps you make sense of the market’s twists and turns. Visiting the page should be a part of every investor’s routine.
Disclaimer: This blog is for educational purposes only and should not be construed as financial advice. The ideas and strategies should never be used without first assessing your own personal and financial situation, or without consulting a financial professional.